General
The "Page views" tab displays all statistics relating to page views on the platform / PWA, broken down by page, by time, by day... as well as the type of device used by participants.
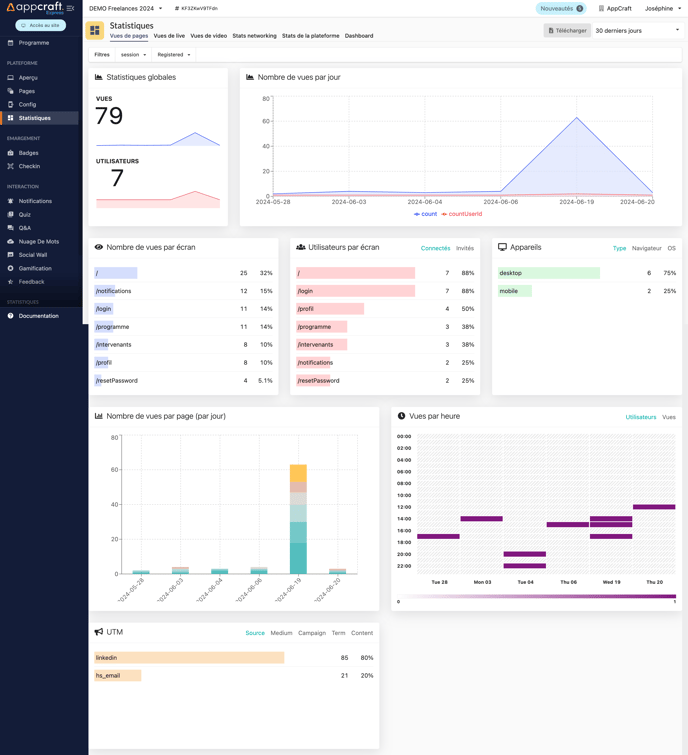
Global statistics
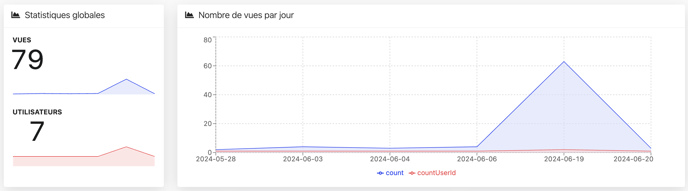
The "Global statistics" insert provides at-a-glance global statistics related to navigation.
Views: the total number of views on the platform / PWA over the selected period. For example, if a participant visits the platform 3 times, this counts as 3 views.
Users: the number of users having visited the platform over the chosen period.
Views per day: graph showing the number of views/users per day over the selected period. Mouse over to highlight figures.
Per screen

Per screen views provide in-depth statistics on navigation on specific pages.
Number of views per screen : the total number of views per page over the selected period. For example, if a participant visits a page 3 times, this counts as 3 views.
Users per screen : the number of users who visited the pages over the selected period.
Devices: identifies whether participants browsed from a computer or a cell phone. You can also see browser type and OS version (Windows 10.0, OS X, Linux, etc.).
Devices:
This data can be very useful to evaluate the use of the mobile version during the event.
Views per page per day / hour
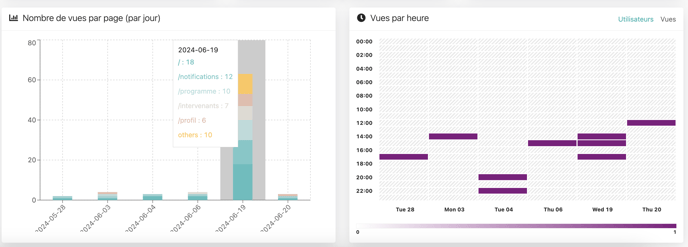
These 2 graphs give a more precise breakdown of views per page per day, and views per hour.
Number of views per page (per day): graph showing the number of global views per page per day. Mouse-over displays details.
Views per hour: provides a graph of views per hour on your platform/PWA.
Views per hour
Views per hour can be used to analyze navigation peaks on your platform / PWA, and thus analyze participant interest.
UTM

If you've set up UTMs, you'll find the various statistics here.
Filters
Several filters are available for your statistics:
- on select columns in participants
- on date range
Column filters: at the top of the page, you'll find all your "select" columns, which you can filter.

This allows you to display statistics only for certain participants, e.g. those coming physically or those present digitally.
Date range filter: in the top right-hand corner of the page, you can choose the period over which you wish to display statistics.

Several date ranges are available. Alternatively, you can choose a customized range.
Date range :
The date range filter allows you to analyze statistics before / during / after your event, and thus measure participant engagement throughout the event.